|
|
|
Sample Survey |
|
|
|
|
|
|
|
|
|
|

|
|
|
|
|
|
|
|
|
A cross tabulation (often abbreviated as cross tab) displays the joint distribution
of two or more variables. They are usually presented as a contingency table in a
matrix format. Whereas a frequency distribution provides the distribution of one
variable, a contingency table describes the distribution of two or more variables
simultaneously. Each cell shows the number of respondents that gave a specific combination
of responses, that is, each cell contains a single cross tabulation.
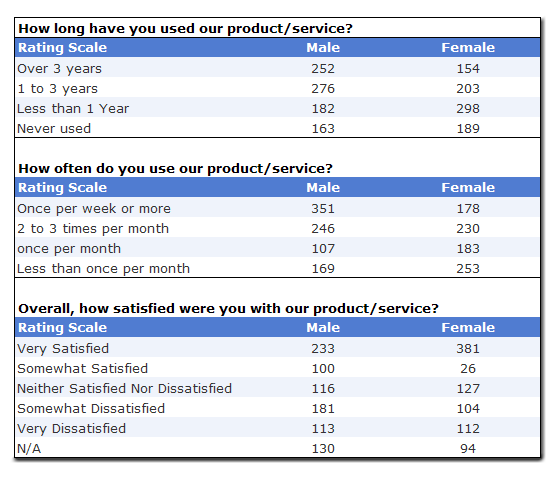
Crosstabs answer questions like: -
What % of males made purchase?
Are males more satisfied with our products than females? etc..
It basically involves the interaction between two questions and a distribution of
how users responded to both of them - taken together.
The following is a sample Cross Tab report

Cross tabs are frequently used because:
- They are easy to understand.
- They appeal to people that do not want to use more sophisticated measures.
- A table can provide greater insight than single statistics
- It solves the problem of empty or sparse cells
- they are simple to conduct
|
|
|
|
|
|
|
|
|
|
|
|
|
|
|
|
|
|
|
|
|
|
|
Survey Application |
|
|
|
|
|
|
|
|
|
|
 |
|
|


